Debug Tools
To help with Jbeam design, the game has multiple debug views that allow you to get more information about your Jbeam.
Console
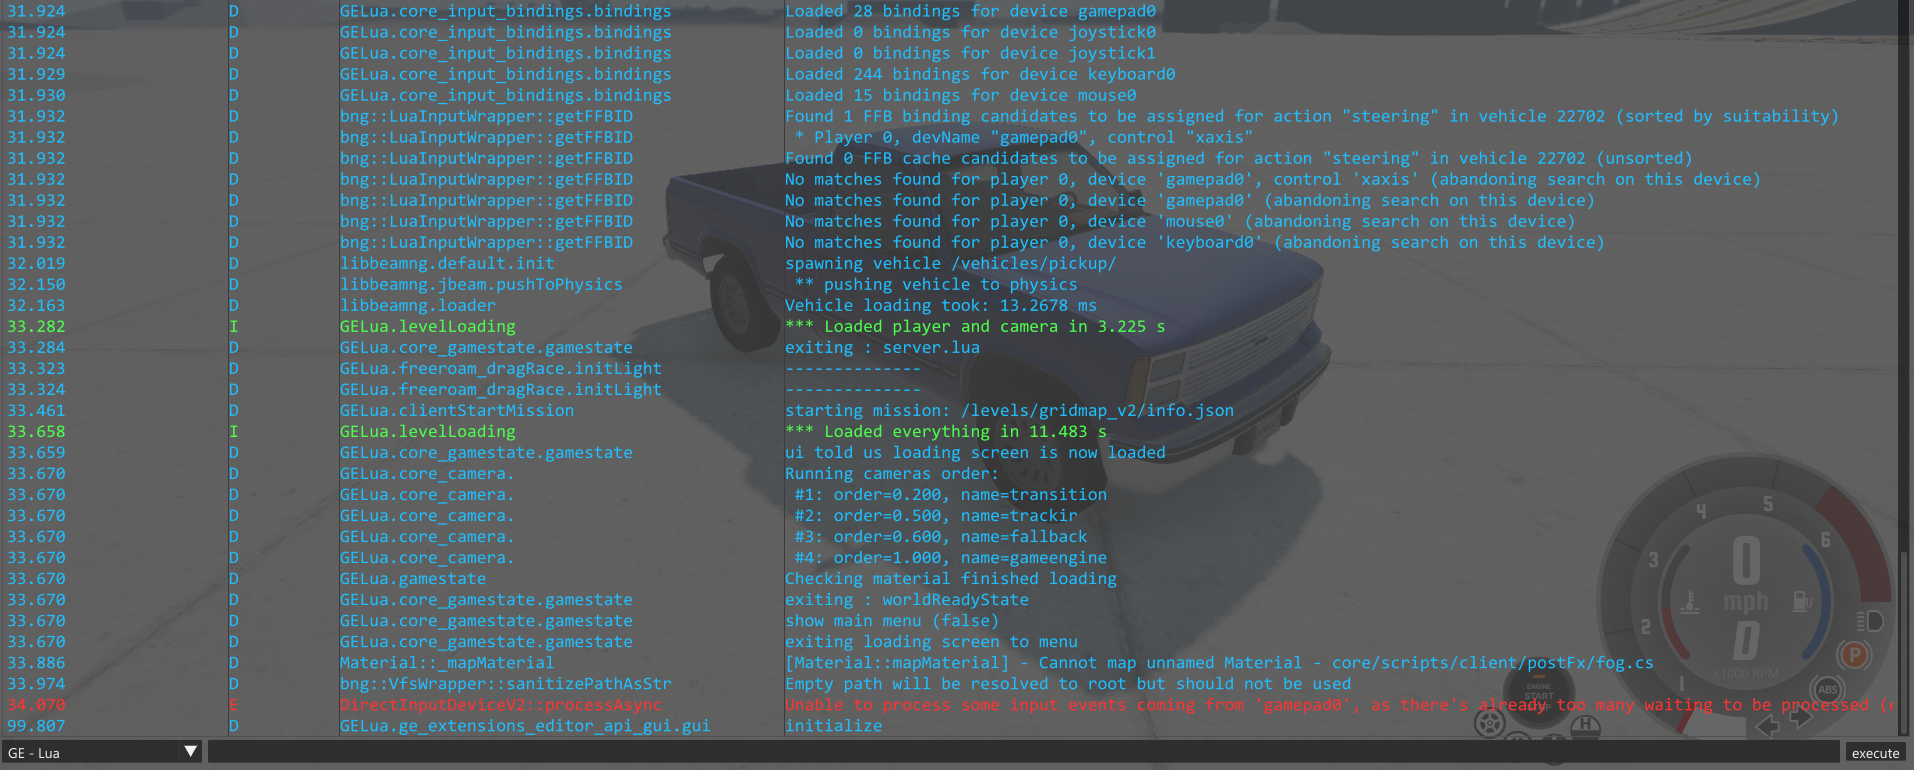
The console can be accessed using `. It shows information and errors that happen while loading a car, and can be helpful to investigate why a vehicle isn’t loading, has missing textures, etc.
The information is color coded, with errors in red, warnings in yellow, info in green and debug information in blue. You can hide the various types of messages by clicking on the buttons in the upper left corner.
The text box at the bottom is used to enter commands.
Slow-Motion
The Slow-Motion tool, while not expressly defined as a debug tool, can be very useful to troubleshoot jbeam issues. It can be accessed in the “Environment” menu, or by pressing Alt + Up
Vehicle Config > Debug UI
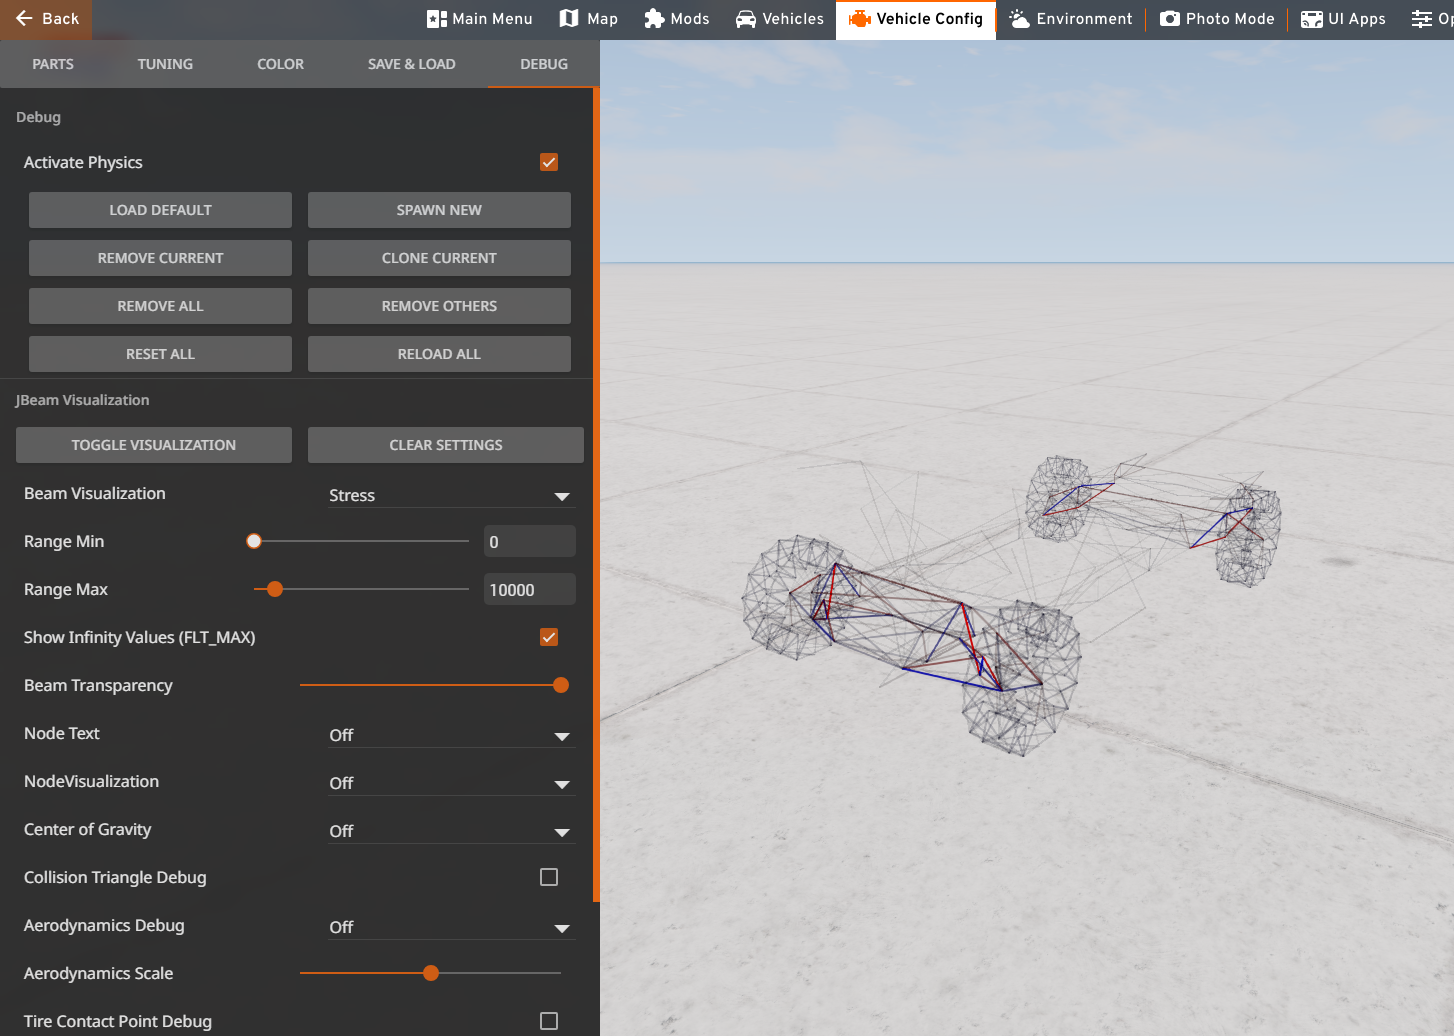
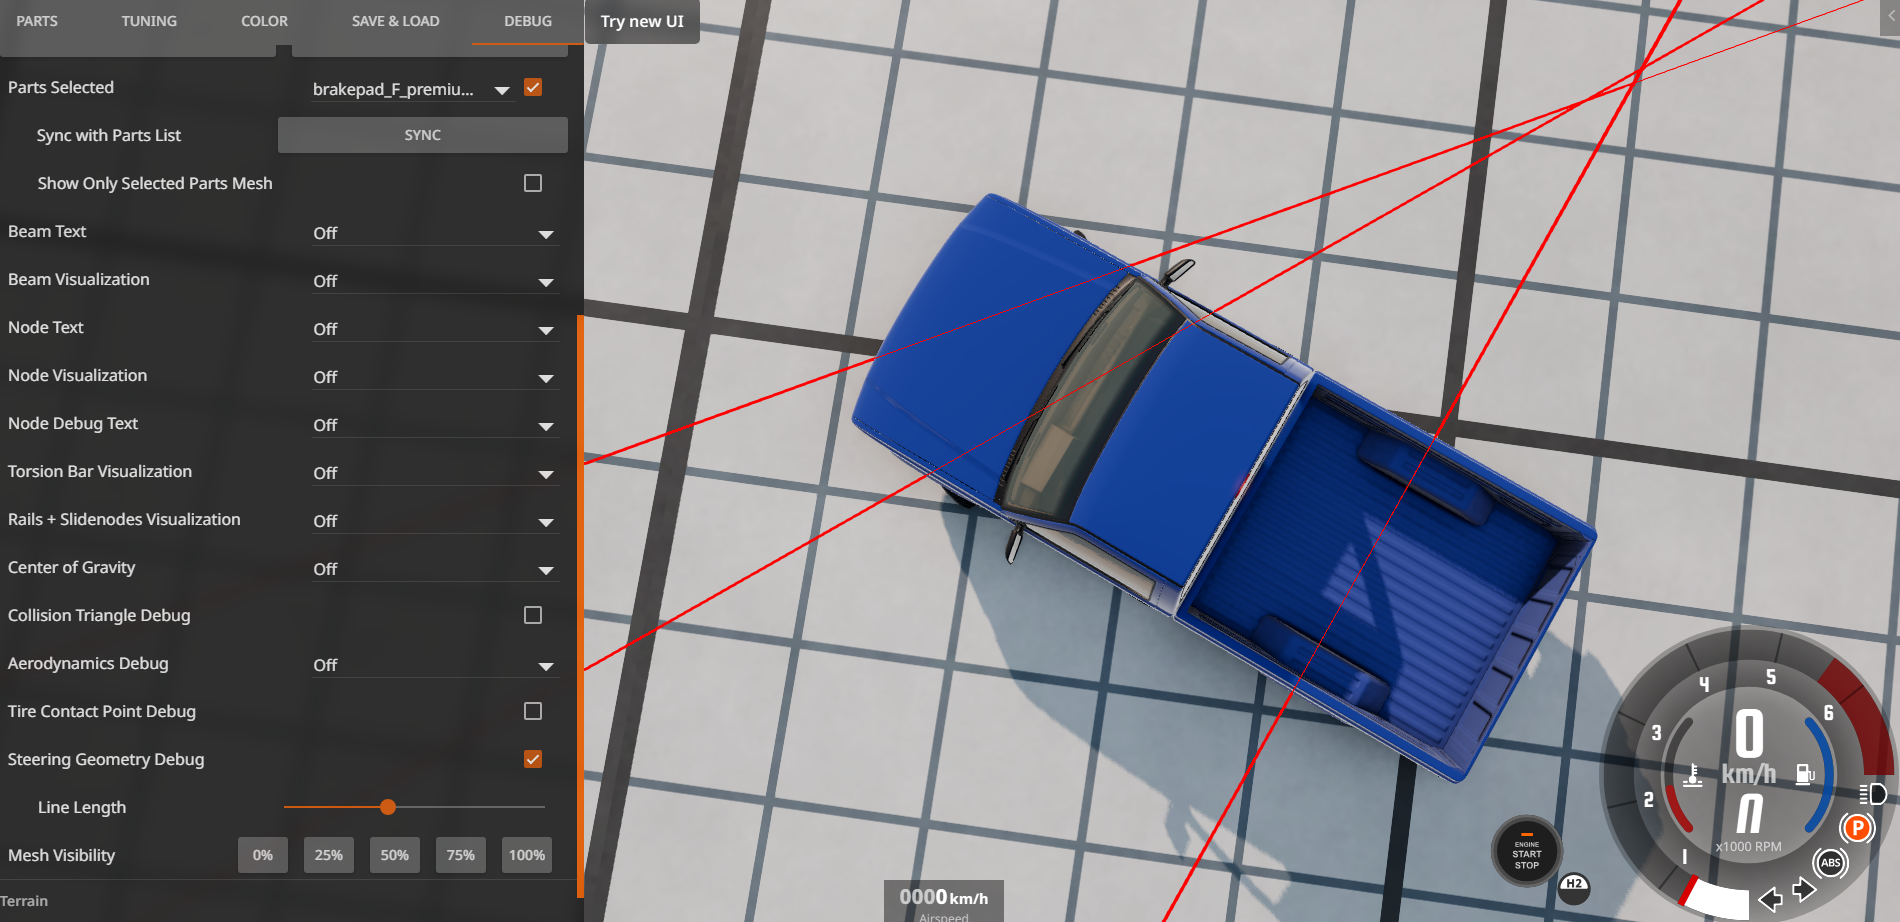
The Debug UI contains many ways to debug the vehicles’ JBeam physics properties. This UI includes the debug modes listed below and also includes vehicle spawning functions.
Debug UI includes a selector of vehicle parts affected by the debug tools which works like a checklist - highlighted parts will be affected, others not. You can use the checkmark icon to quickly select and unselect all parts. After changing a part in the vehicle’s own parts selector or changing a visibility of a part there, changes will be synced automatically. The selector also includes a search bar.
The debug UI includes the following sections, among others:
Node visualization
The node debug views can be accessed by default with Ctrl + M. In the debug UI, you can edit the width and transparency of the highlight.
 The following views are available:
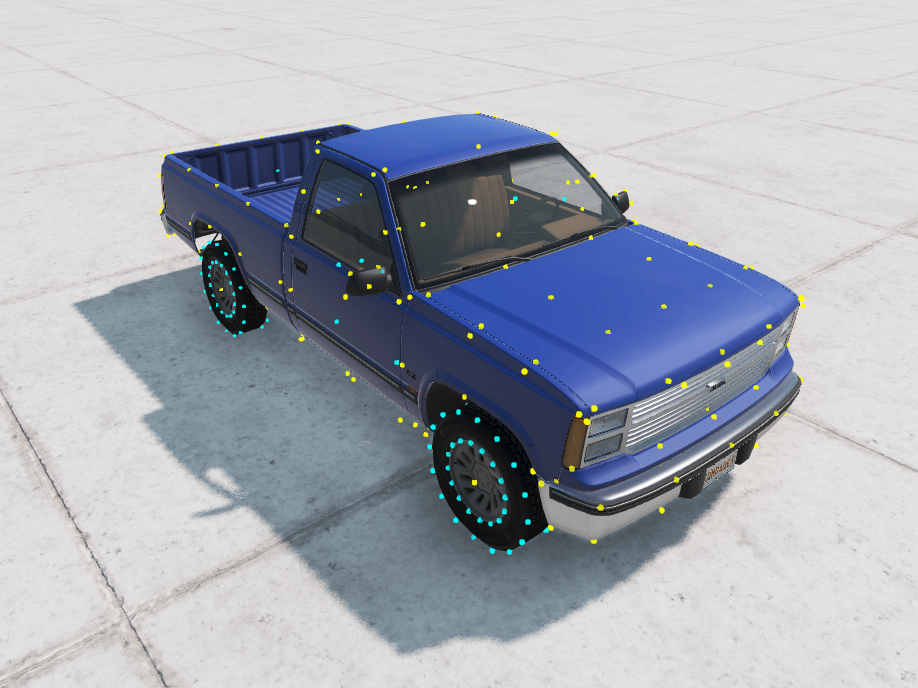
- Simple - Shows the nodes with a color code based on collisions. Yellow nodes have both internal and external collision, light blue nodes have external collision but no internal collision, purple nodes have no collision at all.
- Weights - Shows the nodes as dots whose size varies based on the weight of the node, color coded the same way as in the Simple mode.
- Displacement- Highlights the nodes that have displaced from their initial position on spawn via elastic deformation. The bigger displacement, the more opacity the highlight color has.
- Velocities - Shows node velocity compared to the reference nodes.
- Forces - Shows a vector of the total forces applied on a node. Can be very useful to find instabilities or nodes which are being pushed by unwanted triangles collisions.
- Density - Shows if the node is currently in the air (green) or in water (red).
Node text
The node text views can be accessed by default with Ctrl + N. In the debug UI, you can toggle whether these text are also shown for wheel nodes. This is turned off by default due to them obstructing view and generally not being useful in most cases. The following views are available:
- Name - Shows the name of each node as defined in the jbeam. If it has no name, which is true for wheel nodes, it shows the id number instead.
- Numbers - Shows each node’s id number. Mostly used by lua and the physics engine.
- Name+Numbers - Combination of the two previous modes.
- Weights - Shows each node’s name and weight in kg. Also shows the total weight of all nodes around the top right corner of the screen.
- Materials - Shows each node’s name and assigned material.
- Groups - For each node, shows its name and the group it belongs to. Requires turning on the “Spawn in Debug Mode” checkbox in the debug UI to work.
- Forces - Shows each node’s name and the value of the vector of total forces applied on it. Also shows average force around the top right corner of the screen. Couplers are shown with red font instead of black, and are not counted in the average calculation.
- Relative positions - Shows each node’s name and its position relative to the vehicle’s local coordinates.
- World positions - Shows each node’s name and its position relative to the world.
Node debug text
Shows extra debug text which contains info about some additional properties defined for some nodes. Can be accessed by default with Ctrl + K. The following views are available:
- Latches - Shows sound events related to vehicle latches, such as the open event, close event and break event, along with the name of the latch.
- PropAnimation - Shows sound events related to prop animation controllers, along with the name of the controller.
- Soundscape - Shows sound events related to various vehicle sounds.
- CombustionEngine - Shows sound events related to the engine and exhaust, if they exist on the vehicle. Shows the name of the engine in the label, and additionally in the name of this section, for example “CombustionEngine mainEngine”.
- Powertrain - Shows sound events related to various powertrain devices of the vehicle.
Beam visualization
The beams debug views offer multiple views to help show the various states of beams. They are useful to help building your jbeam, and investigate issues caused by instability or leaking properties. The beam debug views can be accessed by default with Ctrl + B. Some beam debug views have a value range parameter to limit the values that are visualized. This can be set through Vehicle Config > Debug > “Range Min” and “Range Max” sliders and the “Show Infinity Values (FLT_MAX)” checkbox.
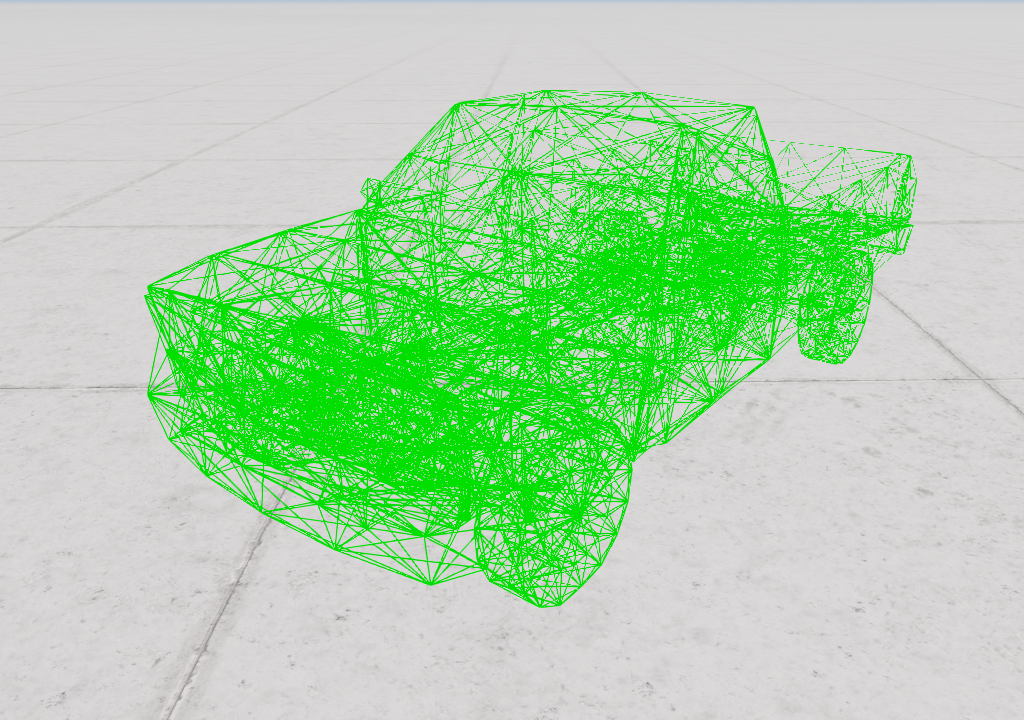
This section contains beam visualization modes based on the current status of the beam in game. Available modes are:
- Simple - Shows the beams in green.
- Type - Draws the beams different colors depending on their type. Regular beams are green, support beams are purple, bounded beams are yellow, hydro beams are dark blue, pressured beams are cyan, l-beams are grey, and anisotropic beams are orange. This color legend can be found in the game as well.
- With broken - Same as the “Type” view, but shows broken beams in red.
- Broken only - Only draws broken beams. Useful to investigate issues like beams breaking on spawn.
- Support only - Only draws support beams that are not broken. Useful for tuning beamLongBound parameter for support beams.
- Stress - Shows how much stress is on the beams, coloring them red in compression, and blue in tension. Useful to see instability issues and vibration. There are two stress modes, one with and one without constraining range values in the debug UI, the latter named “Stress (Old)”.
- Displacement - Shows how much the beams are displaced via elastic deformation from their initial lengths. Blue means the beam has been stretched and red means that it has been shortened. Debug UI lets you constraint range values.
- Deformation - Shows how much the beams are permanently deformed. Blue means the beam has been stretched past its initial length, red that it has been shortened. Debug UI lets you constraint range values.
- Break Groups - Highlights the beams by breakGroups with different colors. Useful to investigate issues of breakGroups that aren’t working as they should, or leaking.
- Deform Groups - Highlights the beams by deformGroups with different colors.
- Bounded Beam Bounds - Shows only bounded beams.
- If the beam has not expanded or compressed from the spawn length (taking precompression into account), it is shown fully in green with no overshoot length from the nodes.
- If it has been shortened from the spawn length, then the current length is shown in green, and it is extended to the spawn length on both sides by dark blue color. If the beam’s shortBound has been triggered, it is shown in cyan color on top of the blue, and additionally light blue visualizes the transition zone.
- If the beam has been extended from the spawn length, then the green color shows the original length, while the extension is filled in by red color. If the beam has expanded beyond the longBound limit, the remaining extension is filled in with yellow color, and additionally orange visualizes the transition zone.
- Support Beam Bounds - Does the same as above, but for support beams. Transition zones are not shown due to being zero length. These beams frequently utilize precompression lower than 1 combined with high longBound values, so they will often have long reaching yellow longBound limits.
- Frequency - Highlights beams which have the set frequency with the set max amplitude.
There also beam visualization modes which visualize beams based on their properties set in Jbeam. These debug modes visualize lower end range values in white, upper end range values in red, and infinity (FLT_MAX) values in purple. The modes for these are:
- Beam Damp
- Beam Damp Fast
- Beam Damp Rebound
- Beam Damp Rebound Fast
- Beam Damp Velocity Split
- Beam Deform
- Beam Limit Damp
- Beam Limit Damp Rebound
- Beam Long Bound
- Beam Precompression
- Beam Precompression Range
- Beam Precompression Time
- Beam Short Bound
- Beam Spring
- Beam Strength
- Bound Zone
- Damp Cutoff Hz
- Damp Expansion
- Deform Limit
- Deform Limit Expansion
- Deformation Trigger Ratio
- Long Bound Range
- Precompression Range
- Short Bound Range
- Spring Expansion
Beam text
Contains extra information for each beam:
- IDs - Shows the internal id of the beam.
- Spawn Length - Displays the original length in meters for each beam.
- Live Length - Displays the current length in meters for each beam.
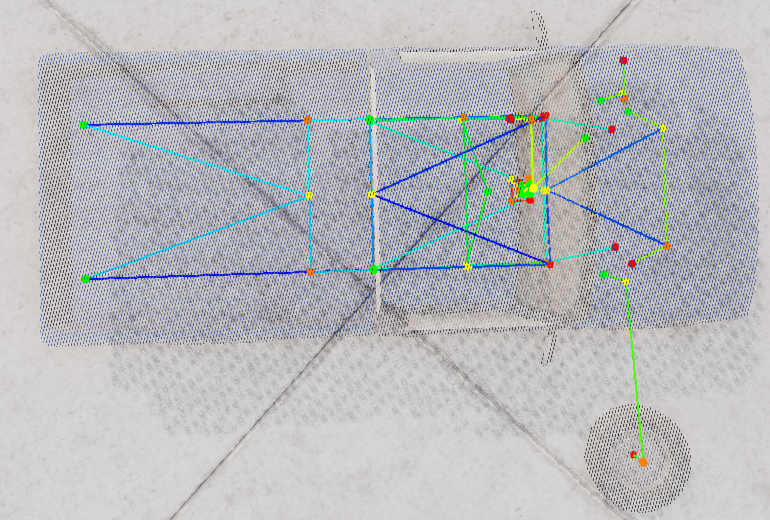
Torsion bar visualization
Only available from the debug UI. Shows torsion bars of the vehicle. Useful to debug stiff structures such as subframes and suspension.
 Available modes:
- Simple - For each torsion bar, it shows its nodes color coded from one end to the other in red, orange, yellow and green colors respectively. Also highlights the connections between these nodes in a different color for each torsion bar.
- Without Broken - The same as above, except broken torsion bars will no longer be highlighted.
- With Broken - The same as above, except broken torsion bars will be highlighted in more visible colors than intact ones.
- Broken Only - The same as above, except it will only highlight the broken torsion bars.
- Angle - The opacity of the torsion bar will visualize the angle between its arms. You can set the minimum and maximum displayed range in settings.
- Stress - The opacity of the torsion bar will visualize the stress between its arms. You can set the minimum and maximum displayed range in settings.
- Deformation - The opacity of the torsion bar will visualize the deformation between its arms. You can set the minimum and maximum displayed range in settings.
- Damp - The color of the connections between the torsion bar’s nodes will visualize its damping the same way beam damp debug is visualized. You can set the minimum and maximum displayed range in settings.
- Deform - The color of the connections between the torsion bar’s nodes will visualize its deformation resistance the same way beam deform debug is visualized. You can set the minimum and maximum displayed range in settings.
- Spring - The color of the connections between the torsion bar’s nodes will visualize its stiffness the same way beam spring debug is visualized. You can set the minimum and maximum displayed range in settings.
- Strength - The color of the connections between the torsion bar’s nodes will visualize its breaking resistance the same way beam strength debug is visualized. You can set the minimum and maximum displayed range in settings.
Rails and Slidenodes visualization
Only available from the debug UI. Shows rails and slidenodes of the vehicle. Useful to debug issues with beam breaking and deformation on spawn due to misaligned slidenodes.
 Available modes:
- Simple - Shows each rail and its slidenodes in their own color. Slidenodes will be thicker than rail nodes.
- Without Broken - The same as above, except broken rails and detached slidenodes will no longer be highlighted.
- With Broken - The same as above, except broken rails and detached slidenodes will be highlighted in more visible colors than intact ones.
- Broken Only - The same as above, except only highlights broken rails and detached slidenodes.
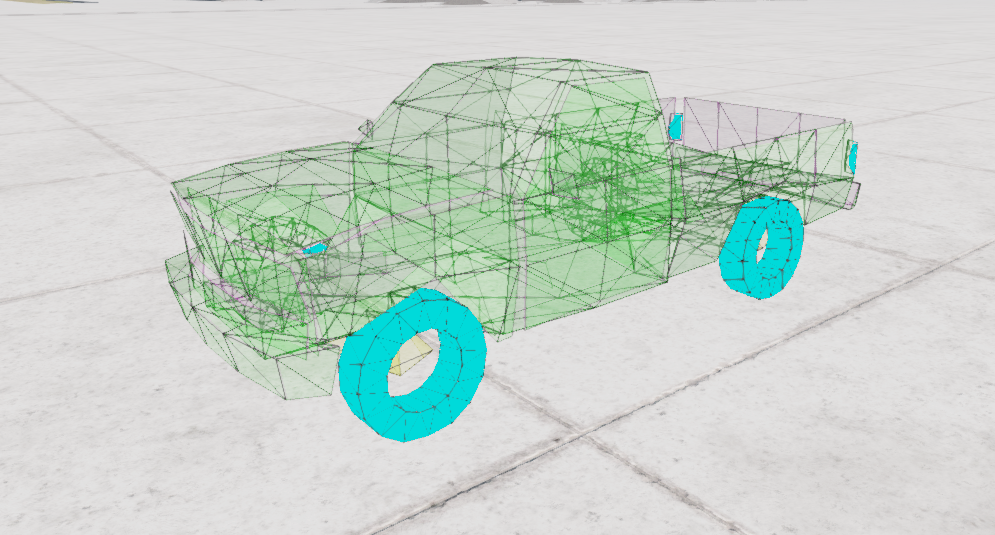
Collision Triangle visualization
The triangle debug view can be accessed by default with Ctrl + T. Useful to debug collision and aero.
 Available modes:
- Simple - Shows the front side of triangles in green, and the rear in purple.
- Type - Same as above, but the front sides of non-collidable triangles are shown in yellow, those of pressured triangles in blue.
- Without Broken - Same as above, but broken triangles are no longer shown.
- With Broken - Same as above, but broken triangles are shown in red color on both sides.
- Broken Only - Same as above, but only shows broken triangles.
- Collidable Only - Same as Without Broken, but also doesn’t show non-collidable triangles.
Others
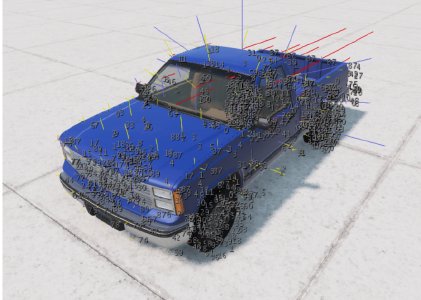
- Aerodynamics debug:
The aerodynamics debug is only available through the debug menu, which can be accessed after enabling advanced functions in the UI options. It is used to debug the aerodynamics of the car, and investigating issues like imbalances in lift and drag. Keep in mind that while the aerodynamic properties are defined with triangles
, forces are calculated at each node, using the properties, size and orientation of the adjacent triangles.
 Available options:
- Drag + Lift - shows 3 vectors for each node. In yellow is the normal vector of the node’s aero surface, based on the size and orientation of the adjacent triangles. In red is the drag applied to that node. This force vector will always be pointing straight back compared to the airflow. In blue is the lift/downforce applied to that node. This force vector will always be perpendicular to the drag.
- Angle of Attack - shows the angle between the node’s normal vector and the airflow. If the normal vector is perfectly aligned with the airflow, the angle of attack will be 90 degrees and the force will be entirely drag. If the normal vector is perpendicular to the airflow, the angle of attack will be 0 degrees and there will be no aero forces on the node.
- Combined - This view combines the information from the previous 2 views.
-
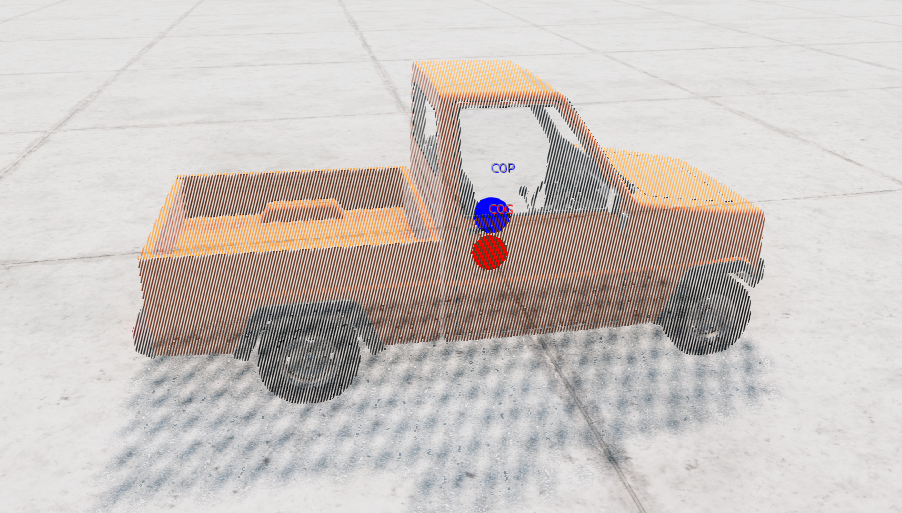
Center of Gravity: The CoG debug view can be accessed by default with Ctrl + G.
 The red dot shows the position of the car’s center of gravity. The blue dot shows the position of the car’s center of pressure, which is where all the drag and lift forces average out. The two different modes show the center of gravity with and without wheels, respectively.
 -
Tire contact point debug: Shows ground contact point for each tire of the vehicle.
-
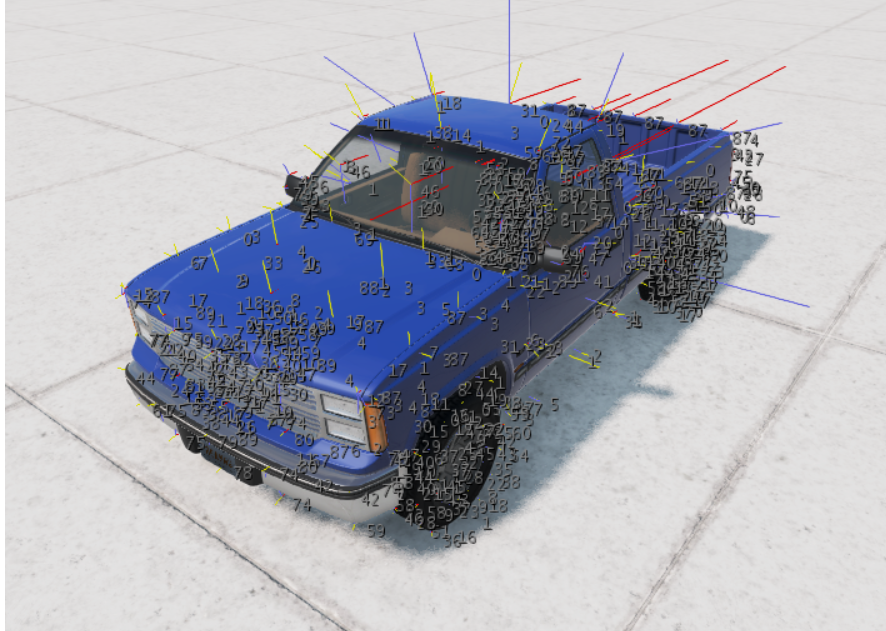
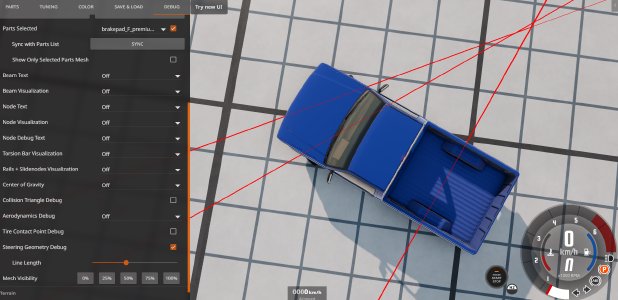
Steering geometry debug (available since version 0.33): Casts rays from wheel centers in both directions. The intersection points between them help visualize and debug the steering geometry. The rays have adjustable length.
-
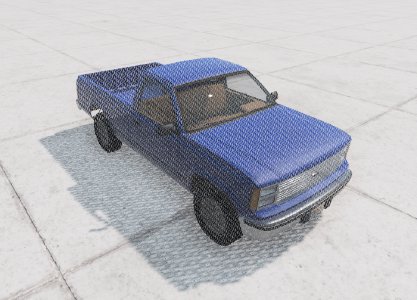
Mesh visibility: While not a debug tool by itself, the mesh visibility scale is very useful to help you see the various debug views better by making the mesh partly or full transparent. The default keys are Ctrl + NumpadPlus and Ctrl + NumpadMinus to raise and lower mesh visibility, respectively.

UI Apps
BeamNG.drive includes a number of useful debug UI apps that can be added to the interface. They can be added in the UI Apps tab in the top menu.
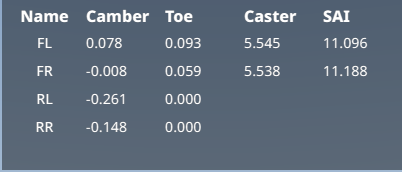
Advanced Wheels Debug
This app shows the toe and camber angles for every wheel on the vehicle, and additionally caster and SAI angles for steer axis wheels. The values are calculated in reference to the vehicle’s refNodes, and are based on the positions of nodes defined in the pressureWheels sections of Jbeam. Can be used to help set up and debug suspension geometry, and also makes refNode alignment issues easy to notice.
Brake Thermal Debug
Allows selecting 2 of the brakes on the vehicle and displays various thermal related values. Can be used to debug brake overheating issues.

Engine Debug
Displays some information about the engine which can be useful to debug energy losses caused by friction or temperature.

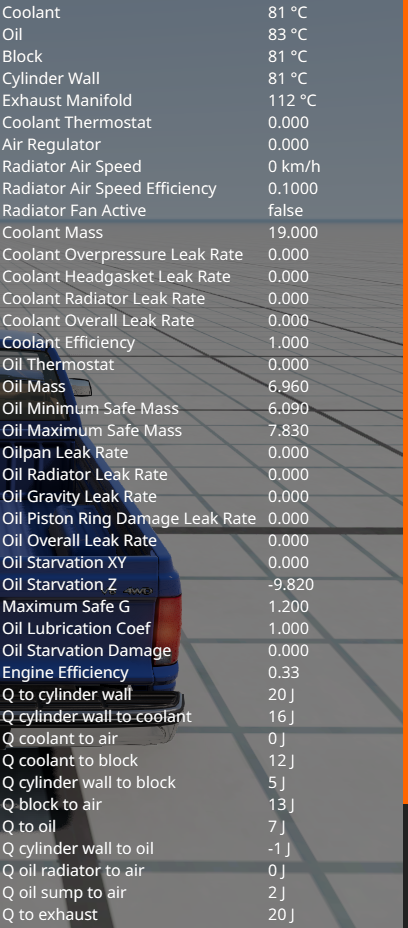
Engine Thermal Debug
An extensive dynamic list of various thermal properties of the vehicle’s engine. Contains information about the engine damage, radiator and coolant efficiency, oil starvation and more. Allows to exactly pinpoint the cause of overheating and oil issues, and helps with cooling system tuning.
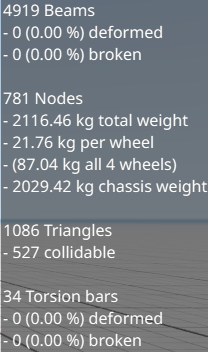
Node/Beam Info
This app reliably displays Jbeam related statistics of the vehicle, such as a number and percentage of deformed or broken beams and torsionbars, precise total weight, number of triangles, etc. Can be used to judge a vehicle’s Jbeam related performance impact compared to other vehicles. Also very useful for finding issues that are otherwise hard to notice and result in a wrong weight or deformed beams.
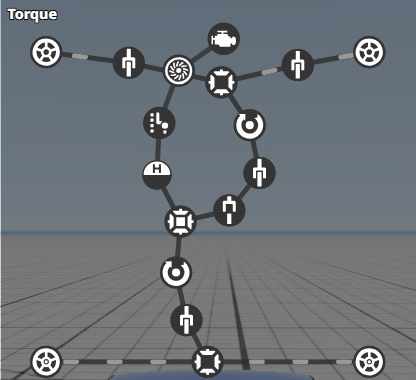
Powertrain Visualization
Visualizes the powertrain tree of the vehicle with all of its components and the torque going through it. This can be changed to power by clicking on the ’torque’ text. Highlighting a component with the mouse will display its name and RPM. Some components such as locking wheel axles, disconnectable shafts, locking differentials and rangeboxes can be interacted with by clicking on them in the app. This app is very useful for debugging issues such as driveline windup and incorrect drivetrain configurations.
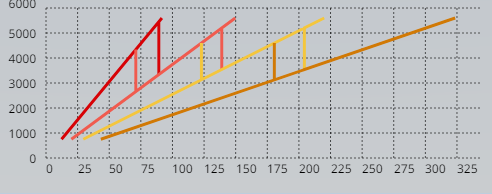
Shift Point Debug
Shows an animated graph of which transmission gears are active on which engine RPM and wheel speed in km/h, with marked shift points and a line showing the current gear. Useful for setting up shift points of automatic transmissions.
Torque Curve
Practically a must have for tuning engines, this app shows the torque to RPM curve in Nm and power to RPM curve in Ps, displaying the current and peak power and torque values together with the current point on the curve. Individual forced induction devices can be toggled on and off in the graph and will be shown with different line styles.

Weight Distribution
Shows the load on each wheel of the vehicle in different ways at once: as a background visual highlighting wheels with over 25% load, as weight load in kg, force load in N, and percentage of total weight on each wheel.

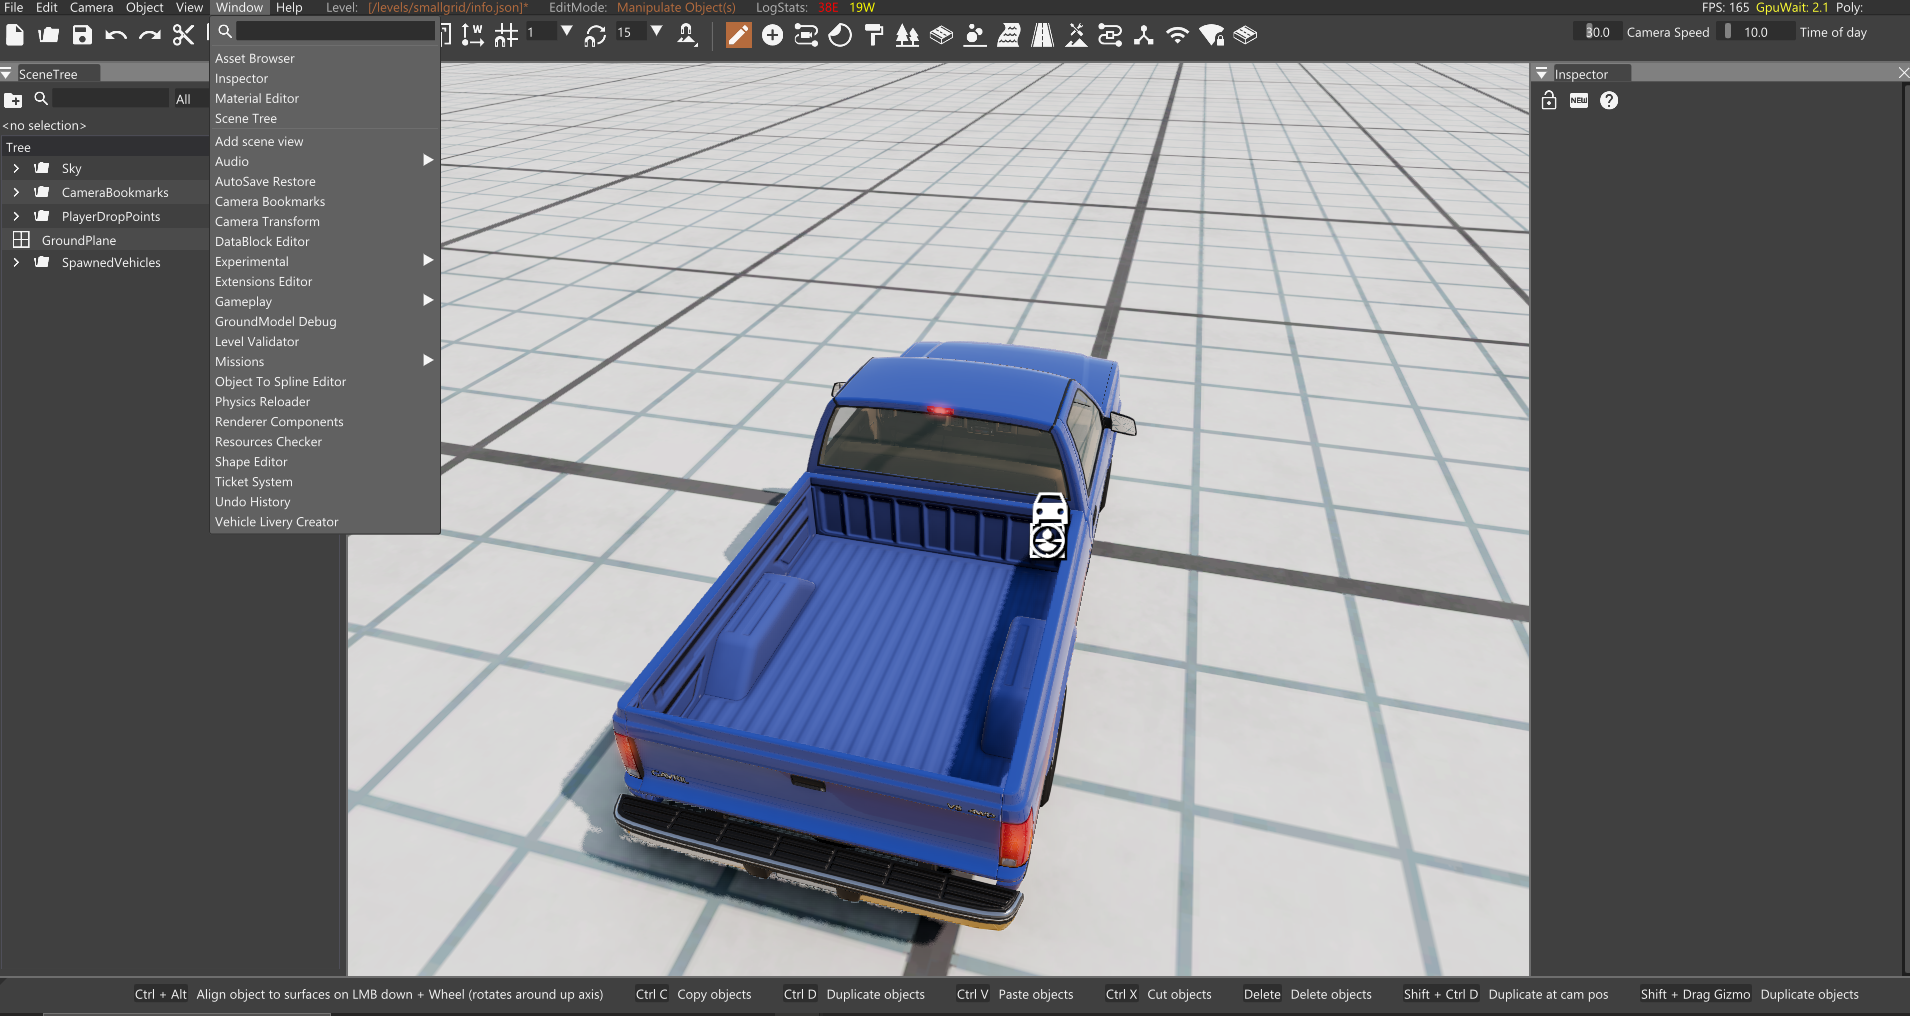
World Editor
The World Editor, accessed with the F11 key by default, contains a few useful tools for Jbeam debugging. They can be added via the Window tab.
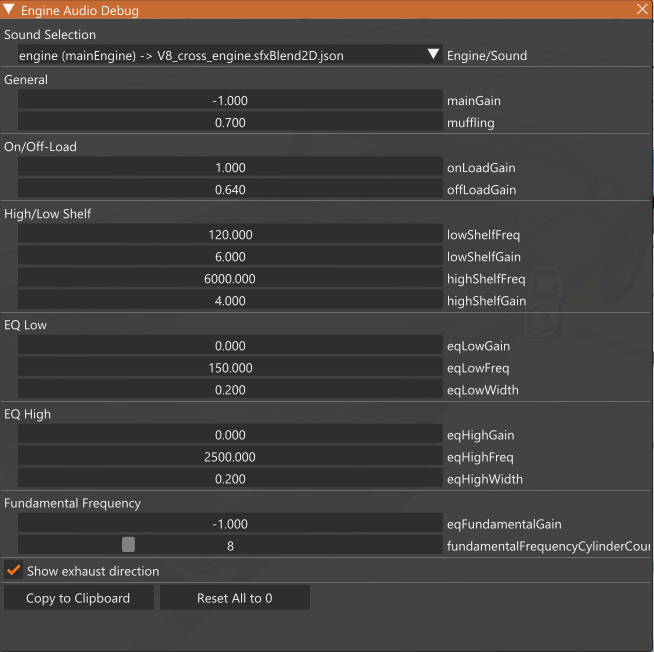
Engine Audio Debug
Found in Audio tab. This tool allows for real time tweaking and testing engine and exhaust sound config values. The resulting Jbeam setup can be copied to clipboard and pasted into the engine Jbeam file.
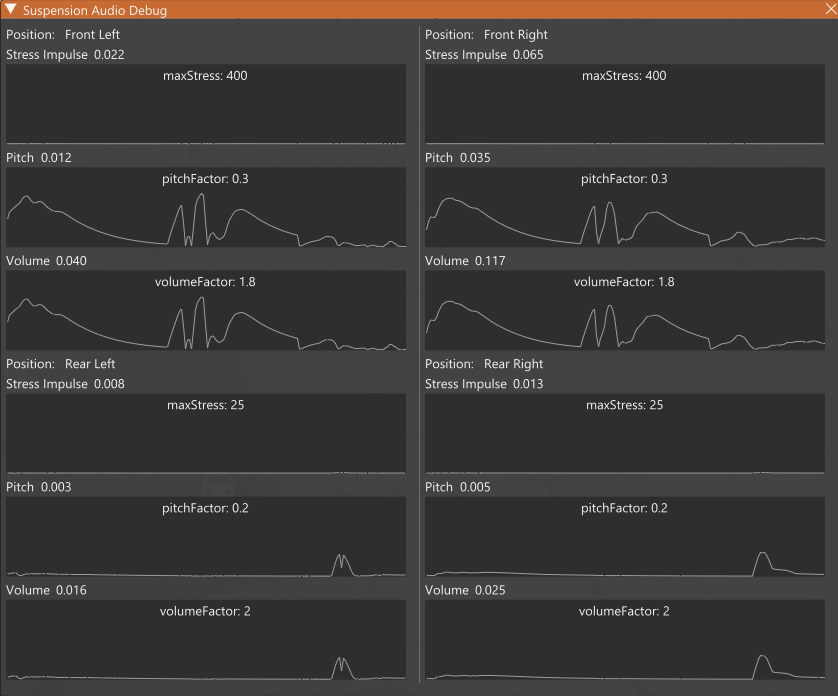
Suspension Audio Debug
Found in Audio tab. Allows debugging suspension sound parameters defined in Jbeam.
Vehicle Detail Viewer
WIP, will be documented later
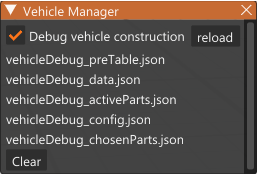
Vehicle Manager
Found in Experimental tab. Upon clicking ‘Reload’, it creates the following files in the userfolder:
- vehicleDebug_activeParts.json: Raw Jbeam data from all active parts on the vehicle in the Json format.
- vehicleDebug_chosenParts.json: List of all the parts currently equipped on the vehicle and their slots, formated similar to the .pc configuration files.
- vehicleDebug_config.json: Configuration file of the current vehicle, similar to a .pc file but with more data.
- vehicleDebug_data.json: All of the data of the vehicle as seen by the game engine.
- vehicleDebug_preTable.json: All of the Jbeam sections from all of the parts of the vehicle merged into one Json file.
 The Vehicle Manager allows for debugging issues with calculations and string concatenation in Jbeam, by displaying how this data is seen on various stages of its processing.
Vehicle Editor
The Vehicle Editor is a group of useful Jbeam tools which can be accessed via Shift + F11 or from the World Editor tabs: Window > Experimental> Vehicle Editor. It has two tabs: Static Editor, focused on editing Jbeam files, and Live Editor, focused on debugging Jbeam behavior in real time. Both have customizable layouts that can be saved, allowing the user to have their favorite tools always on display.
Static Editor Apps
- Jbeam Modifier Leaking Visualizer: Shows which Jbeam values used in parts leak to parts loaded after them.
- Jbeam Spellchecker: Searches all Jbeam files for section name typos and then prints them in console.
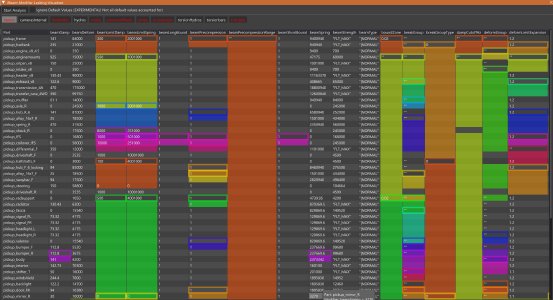
- Jbeam Table Visualizer: Shows tables of the chosen Jbeam files on the UI.
- Jbeam Variables Checker: Searches all .pc fies for variables that are out of range according to the Jbeam files they are defined in and then prints them in console. (May produce false positives in case the same variable is defined in multiple files with different ranges)

Live Editor Apps
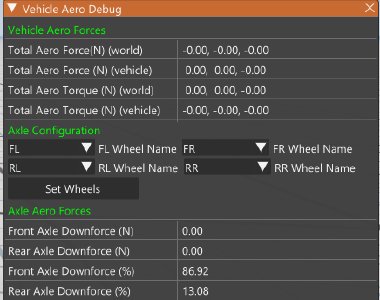
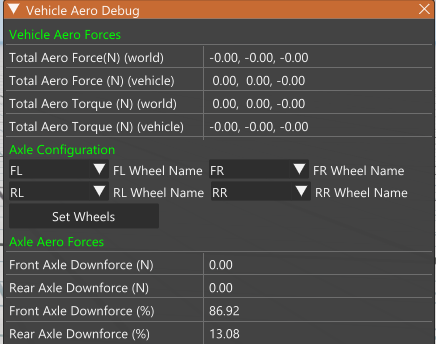
- Vehicle Aero Debug: Shows various values related to aerodynamics, the most useful being axle downforce.
- Beam Visualization: Same thing as in the debug UI.
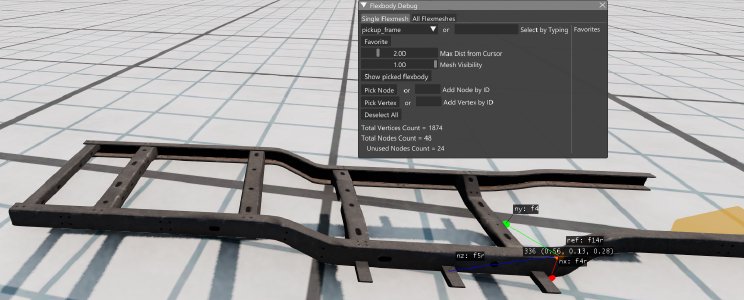
- Flexbody Debug: Very useful when debugging spiking and stretching issues, allows you to see which nodes each vertex of the model is interpolated by, and which vertices each of the nodes in Jbeam interpolates. In the ‘All Flexmeshes’ tab, it has tools that can automatically find potentially problematic areas where vertices lack nearby nodes, which can cause spiking issues.
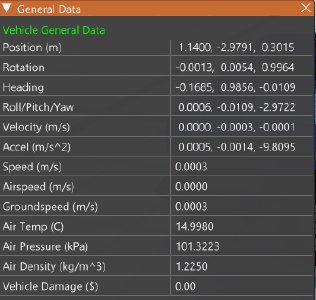
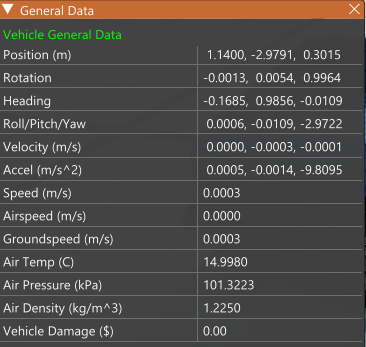
- General Data: Shows some basic useful data all in one place.
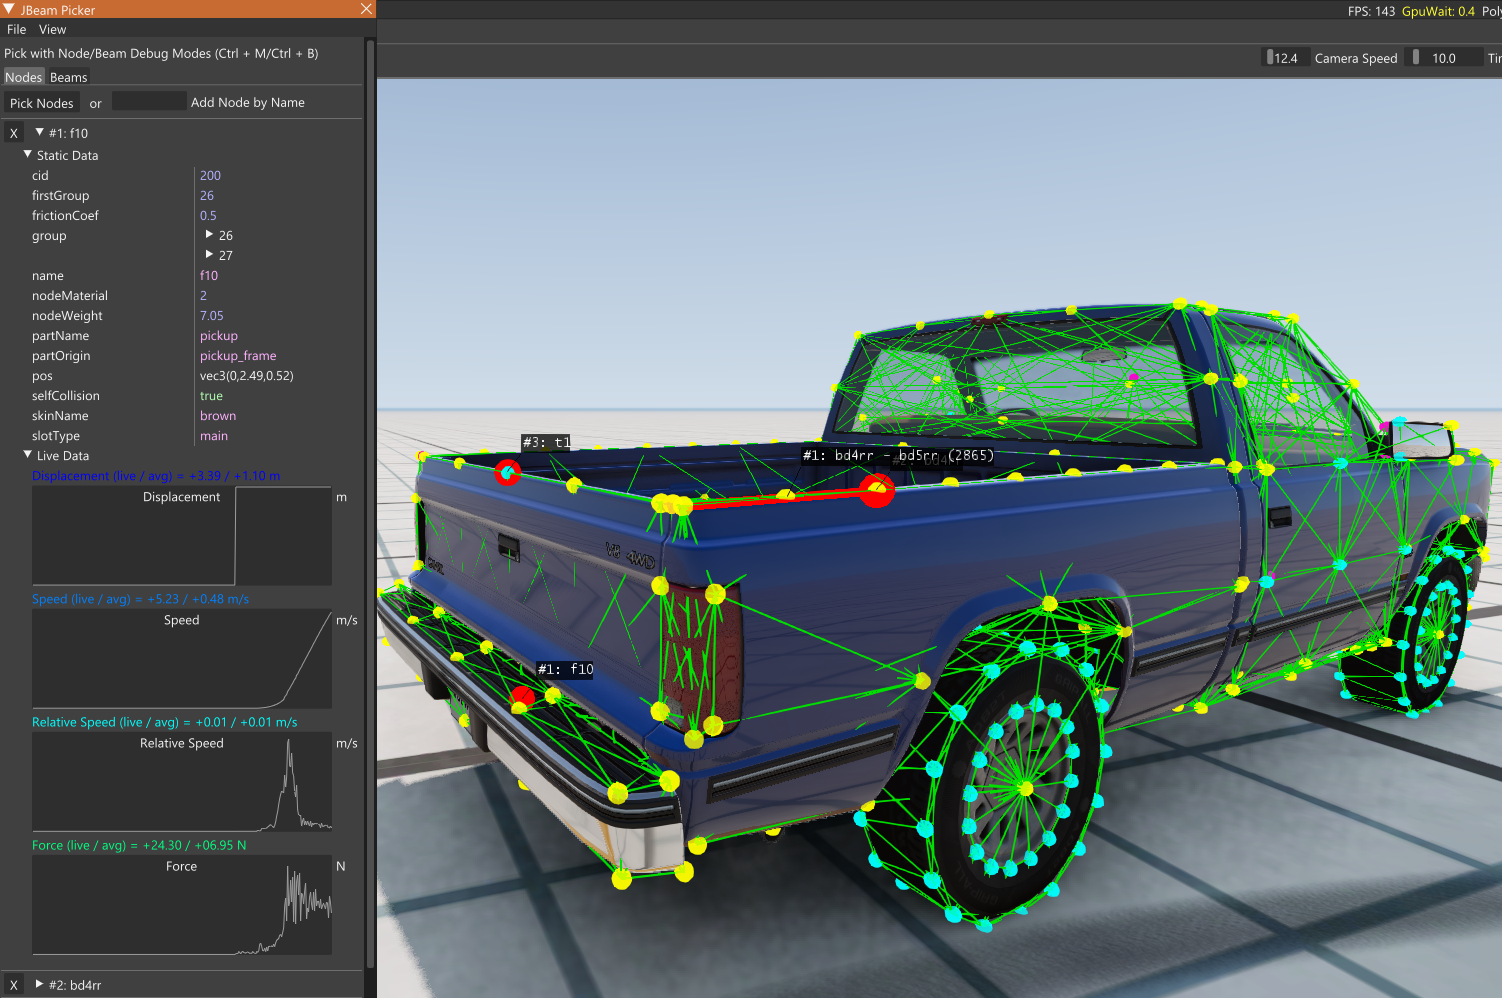
- Jbeam Picker: Allows for picking individual nodes and beams of the vehicle with the mouse cursor, and displaying some static and live data of them.

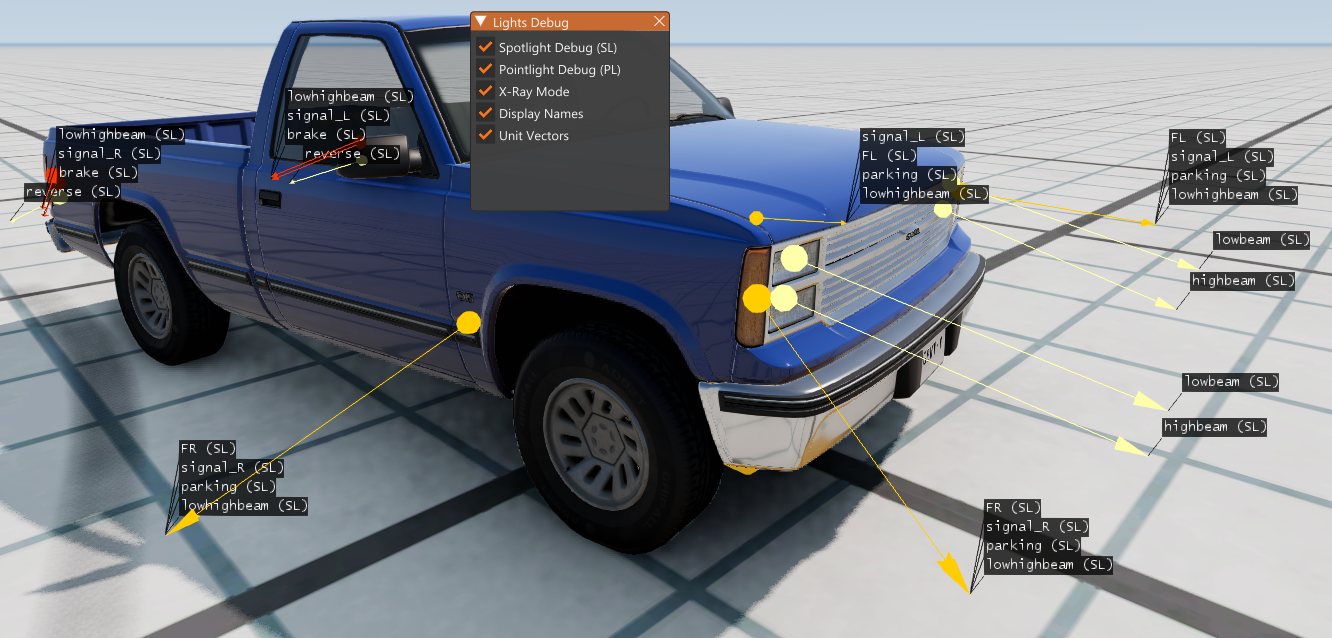
- Lights Debug: Shows the directions in which all of the lights on the vehicle are being cast.

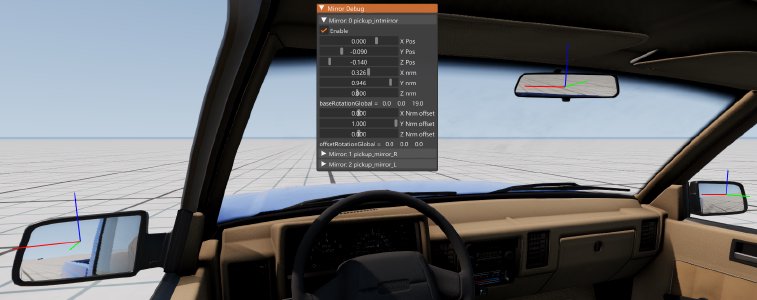
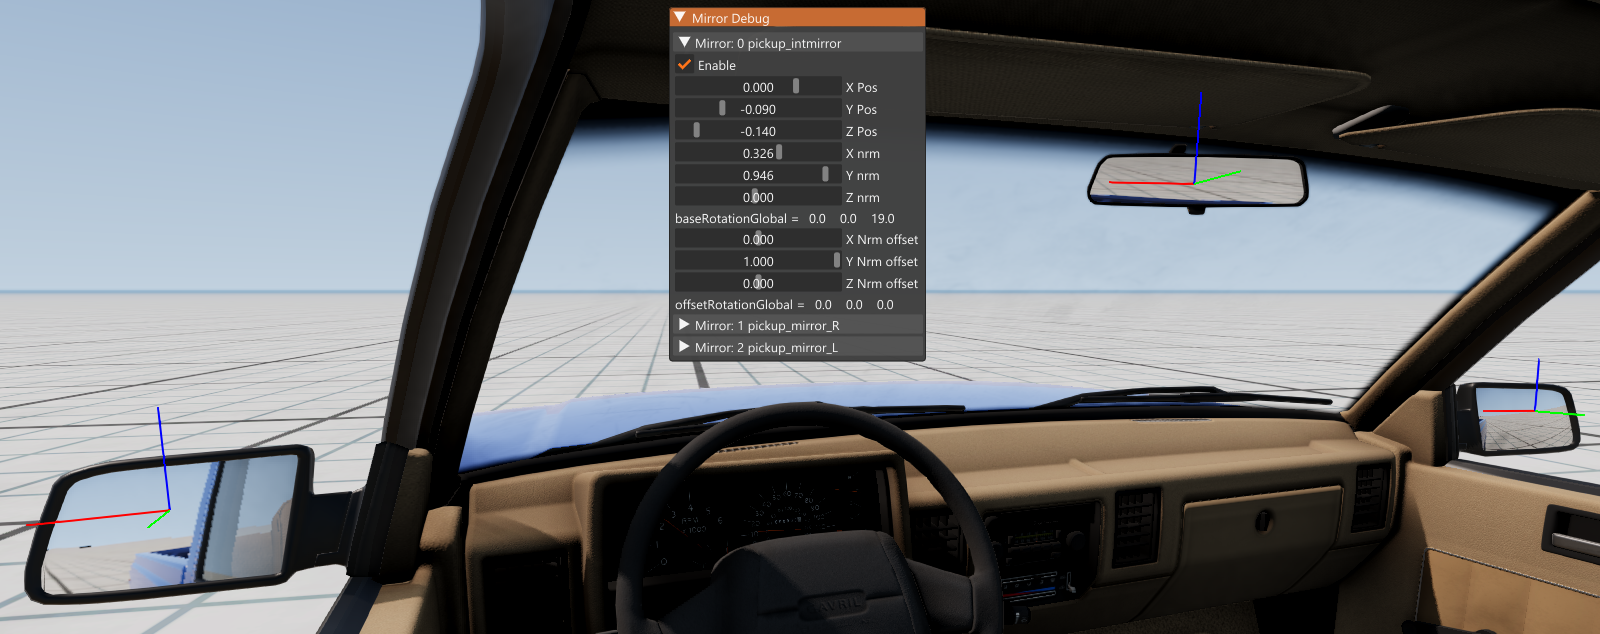
- Mirrors Debug: Allows testing mirror Jbeam parameters in real time using sliders.
- Node Visualization: Same thing as in the debug UI.
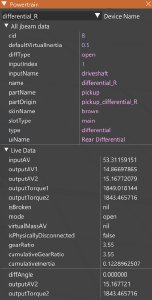
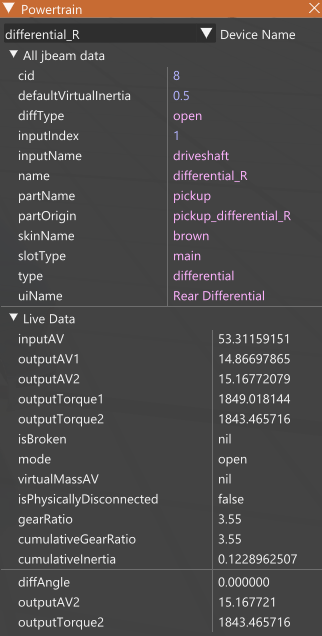
- Powertrain Inspector: Shows static and live Jbeam about a selected powertrain device.
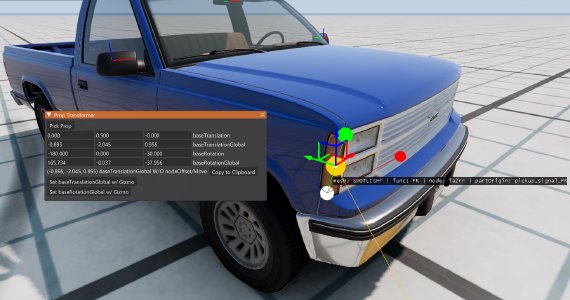
- Prop Transformer: A very useful utility which makes positioning props on the vehicle much easier. To select a prop, click the ‘Pick Prop’ button. Some points will appear on the vehicle, they are origin nodes of the props, you can cycle between different props in each origin with the scroll wheel. You can then use the buttons at the bottom to enable a 3D gizmo which will allow you to set the position and rotation of the props. Finally, you can copy the values from text fields to your Jbeam. You can do it manually or automatically with a button if you are using baseTranslationGlobal.
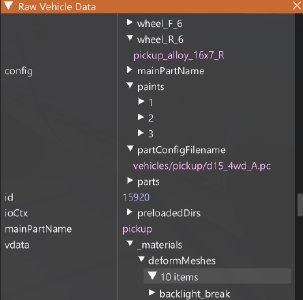
- Raw Vehicle Data: Shows all of the vehicle data from game engine.


Props
There are some spawnable props in game that can help with tuning Jbeam parameters. Make sure to turn on the Include Auxiliary Debug Content checkbox in the vehicle selector to see them.
Roof Crusher Tester
This prop is used to replicate the IIHS vehicle roof strength test in order to achieve realistic roof deformation on vehicles.
Usage tutorial
- Open the body JBeam file of the vehicle you want to test and add the {“fixed”:true} tag to the floor nodes.
- Spawn the Roof Crusher Tester on the Grid, Small, Pure map. You can find it near the bottom of the list if you have the “Include Auxiliary Debug Content” option checked. Spawn the car you want to test, and move it to the center of the crusher via World Editor. Use the base model of the car.
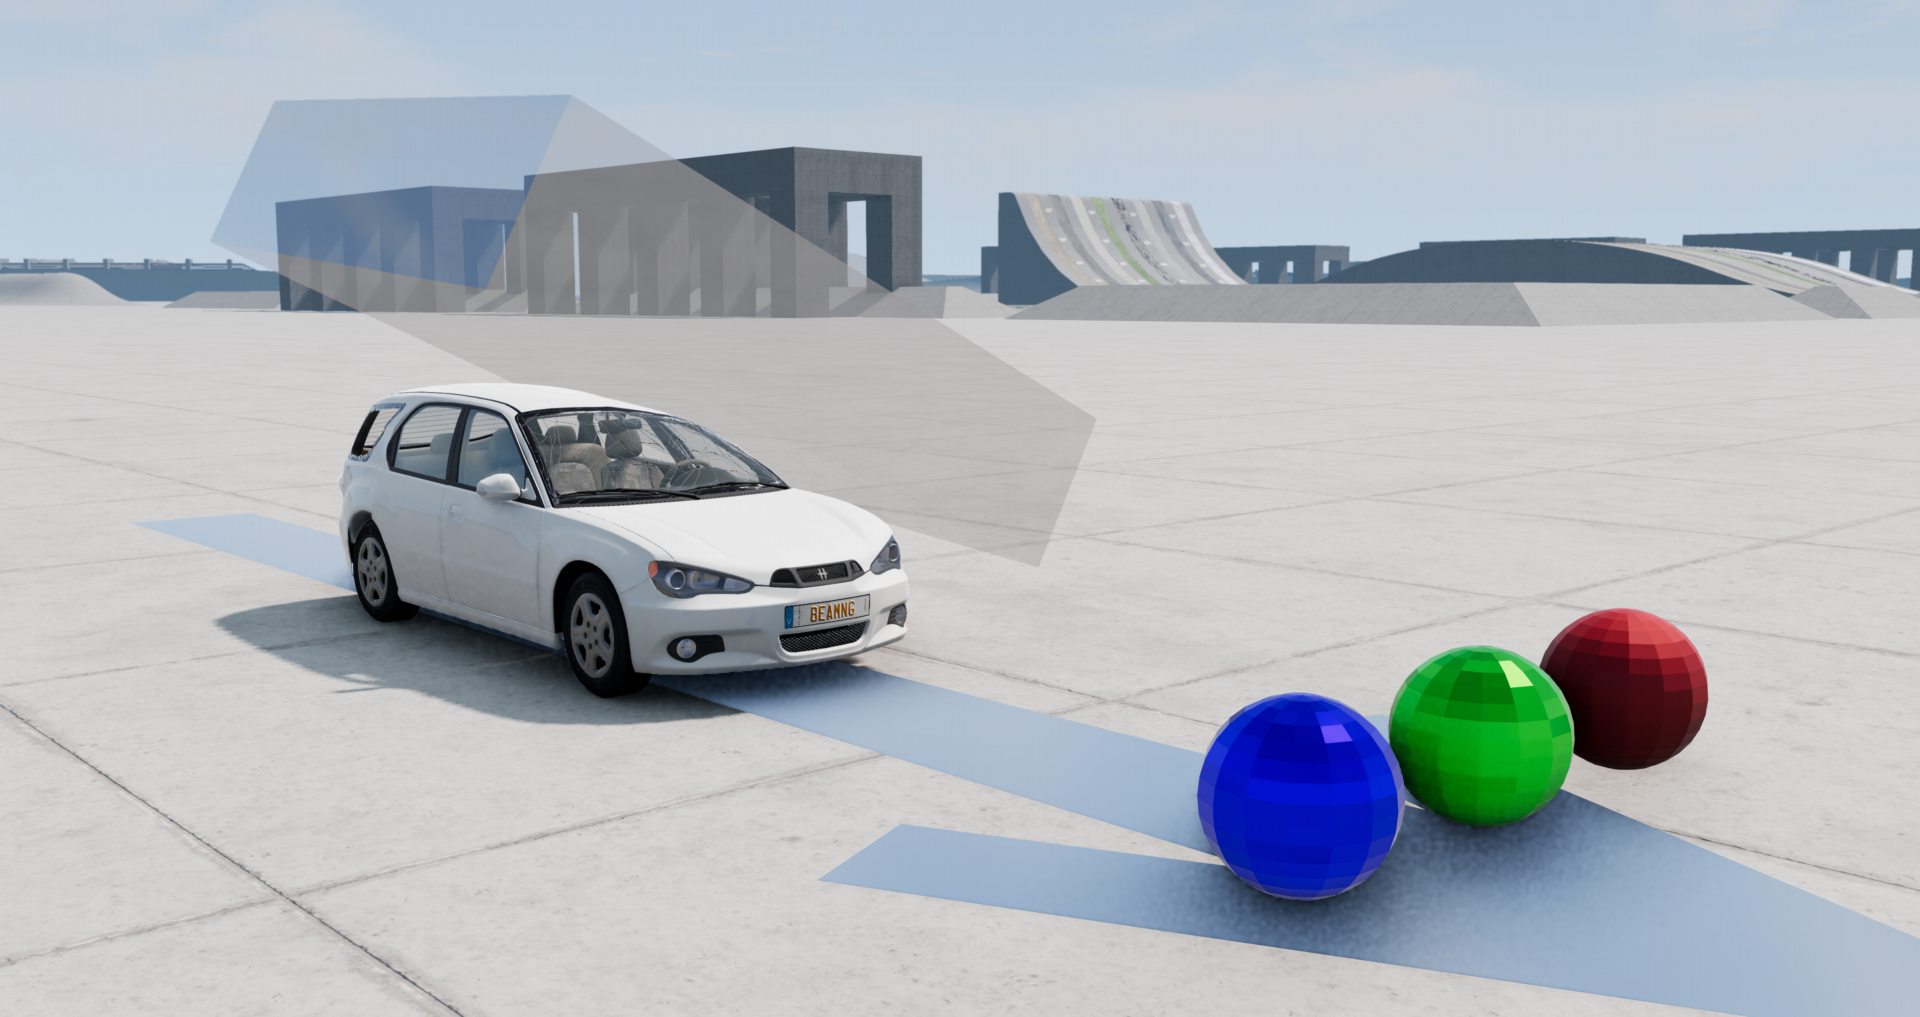
- Click the blue ball on the crusher and wait until it touches the roof of the vehicle. If it doesn’t touch the roof properly, you might have toremove some parts, or use the red and green balls to tweak the position. For low vehicles, you can also move the car up via World Editor.
- Click the blue ball again and wait for the UI message with the measured force. You will also find the reading in the console. If the vehicle’smirror has interfered with the test (can happen on mods based on old vehicles), redo the test with the mirror removed.
- Calculate the roof weight rating of the vehicle, by dividing the test result value by 9.81.
- Calculate the vehicle’s expected roof weight rating, by multiplying its weight by the IIHS roof strength test result rating. Use the closestpossible vehicle if you can’t find the exact model.
- Pre-2013 vehicles will usually have the rating of around 1.5, it will be lower for cheaper cars, for very cheap ones it can go down to 1.00 andexpensive ones can reach around 1.75. Most 1980-2005 cars will have the rating above 1.5, and later can reach above 3. In 2013 the standards haveincreased drastically, it will be around 4 for them. 2016 and later always have a rating of at least 4, for very heavy or expensive cars it willreach above 5. SUVs can be much stronger or much weaker than normal cars depending on the body structure design.
- Tweak the Jbeam until you reach a reasonable result (around 2x better rating than irl is fine). You might have to rework the Jbeam for the roof and each pillar to have its own rigidifiers, connected to each other with easily deformable beams. You may have to test how much the glass affectsthe results and weaken it accordingly. You might also have to tweak or remove breakable body beams.
- Remember to retune the strength of the floor afterwards in order to preserve the head-on impact strength of the vehicle.
Was this article helpful?