Windows
Welcome
The Welcome window is the starting screen for Flowgraph.

It provides you with options for:
- Creating or opening projects
- Opening recently used files
- Opening example projects for Flowgraph
- Opening projects for more complex scenarios
Main Window
The “Main Window” visualizes Flowgraph for you.
It displays all the different kind of nodes and links that are present in your flowgraphs, stategraphs and groupstates.
Overview
Tabs
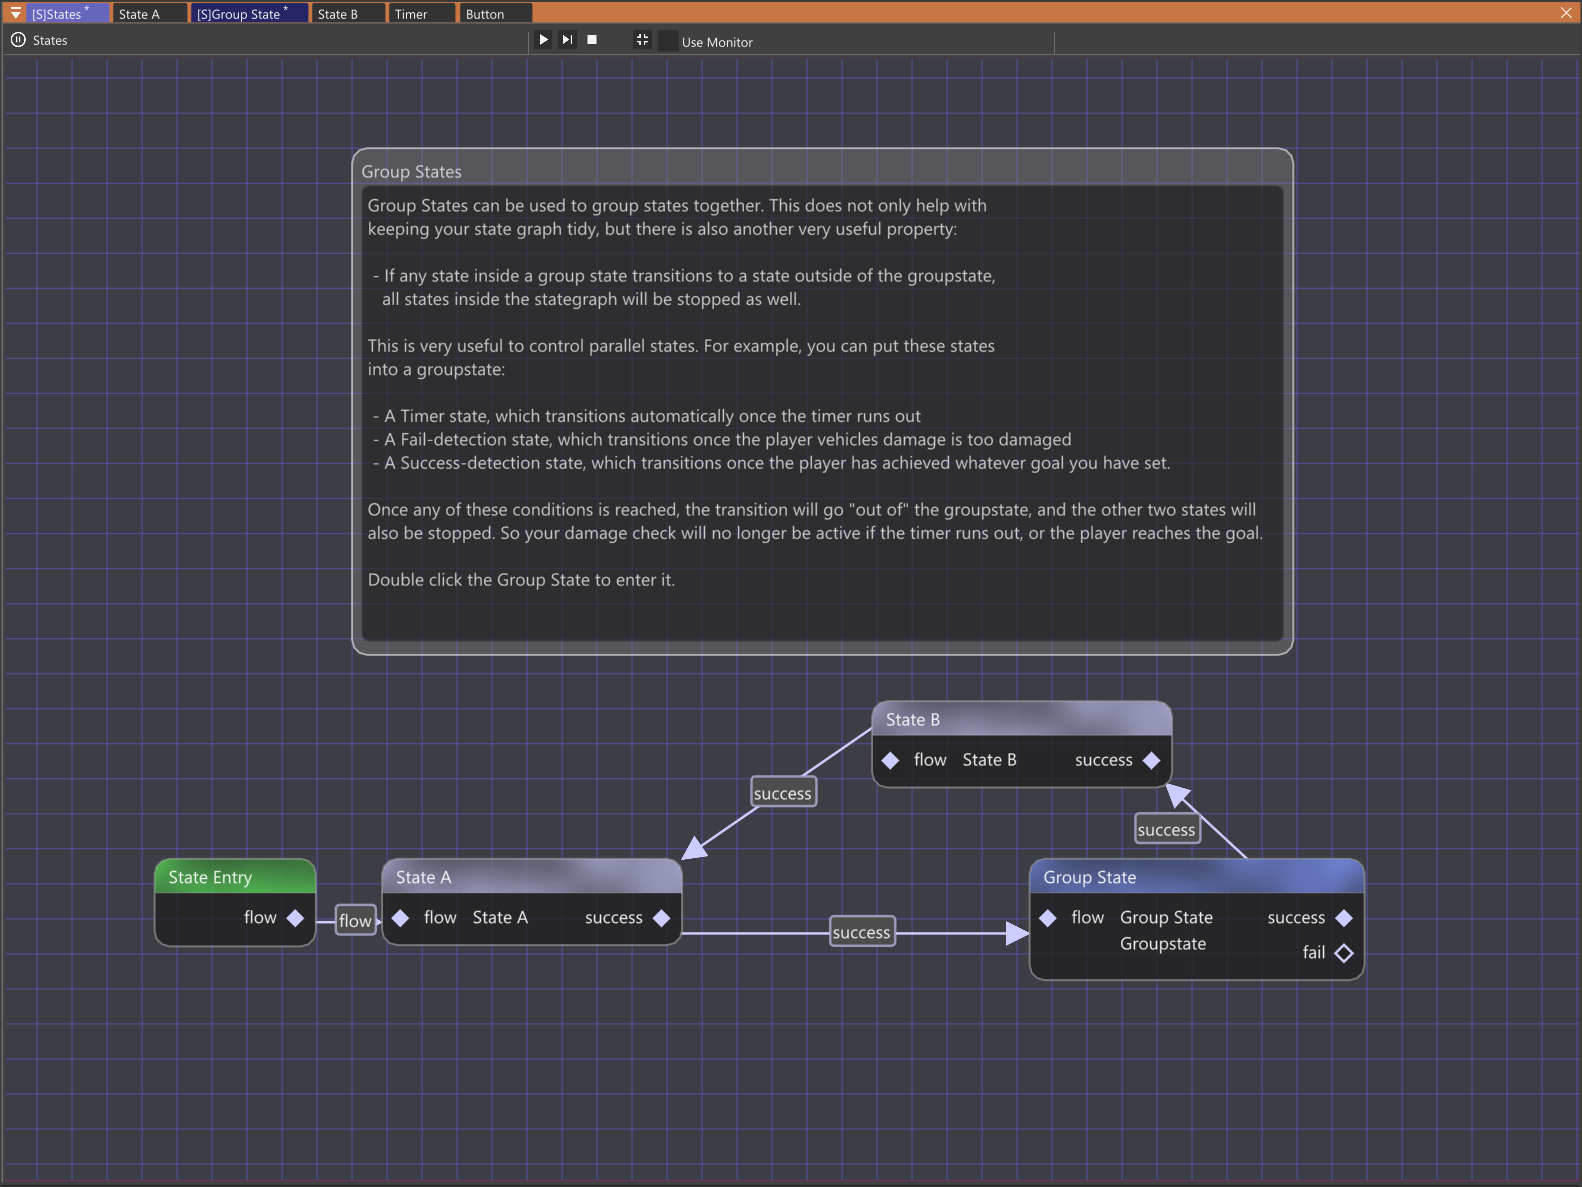
In the top of the main window you can see an overview of tabs of all currently opened graphs in your project.

You can switch between them by clicking on the tab you want to view. The tab you are currently viewing is highlighted and stategraphs and groupstates are marked with an “[S]”.
The “*” symbol marks a graph that still has unsaved changes. You can press Ctrl+S to save your project or go to File -> Save.
Toolbar
Under the tabs of your graphs, you find a toolbar with essential functionalities for working with Flowgraph.

-
 shows if your project is currently running and displays the name of the currently viewed state.
 -
 let’s you start your project. This may take a moment, if the level still needs to be loaded.
 -
 let’s you start and immediately pause the project. After this you can step through the graph frame by frame for debugging.
 -
 let’s you stop the project again, after it has been started.
 -
 minimizes the WorldEditor and displays the FG Monitor
.
minimizes the WorldEditor and displays the FG Monitor
. -
Use Monitor can be toggled to hide the WorldEditor and displays the FG Monitor on start.

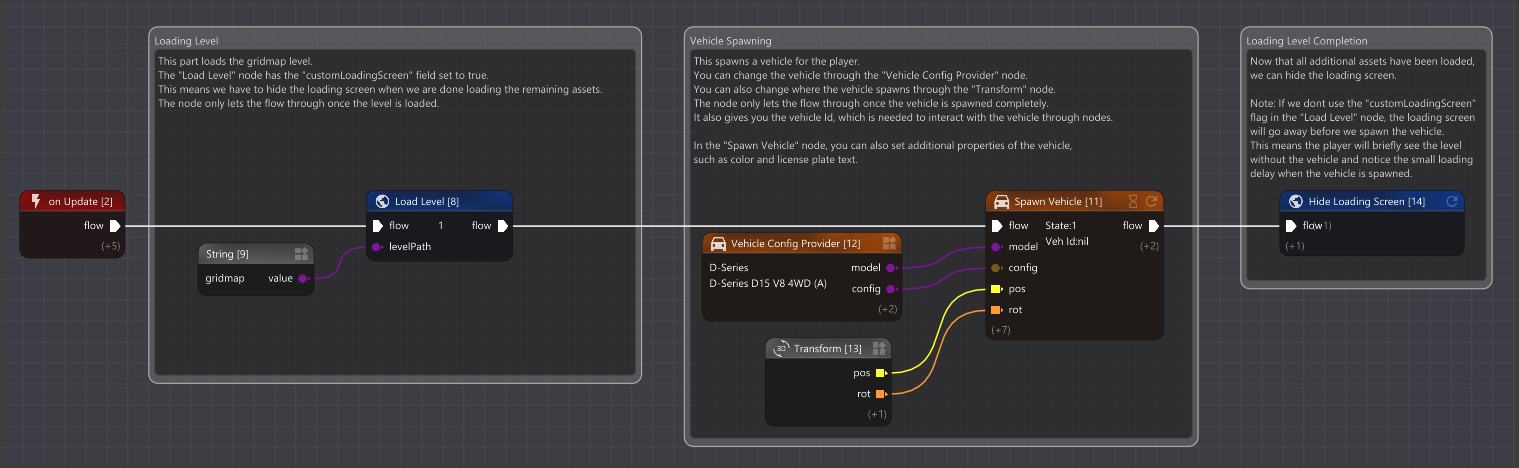
Viewmodes
Viewmodes provide you with different ways to visualize your flowgraph.
-
Default
The “Default” viewmode is the standard viewmode on startup.
It simply visualizes your flowgraph with all its nodes and links.
-
Heatmap
The “Heatmap” viewmode is a great tool for visualizing flow during runtime. Nodes that have been activated become colorized and then start decaying in color over time. This makes it possible to see where your flowgraph is currently active.
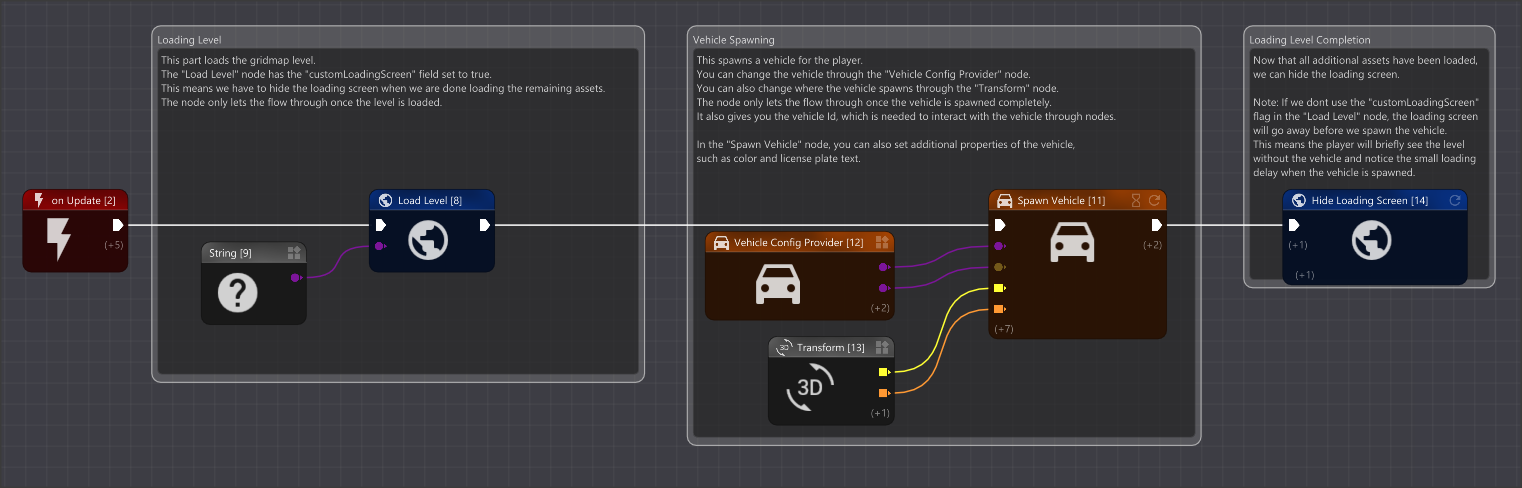
-
Simple
The “Simple” viewmode gives you a simplified view of your flowgraph.
It hides unnecessary UI like pin descriptions, so you can get a more clear view of your project.
Interacting with the Main Window
Moving through Flowgraph
Since the Main Window is your main workstation for interacting with your graph, you want to be able to get around easily.
To move your view on the graph simply hold Right Click and drag the camera around.
Moving Nodes
To organize your graph you can of course also move your nodes around the graph.
Simply grab them with Left Click and hold it to drag them around the graph.
Creating Nodes
There are multiple ways to add nodes to you graph.
The simplest way is pressing Right Click on a free space in the graph and selecting the node you want from the context menu.
Another way to add a new node is by pressing Left Click and dragging a link from a pin to a free space in the graph.
This will directly connect the newly created node to the pin.
At last you can also create nodes through the Node Library.
You can read more about it down below.
Connecting Nodes
To bring interaction to your graph, you of course want to connect the different nodes in your graph.
Simply press and hold Left Click on a pin to connect it to the pin of another node.
If you are unable to connect two pins, it is most likely, because one of the pins is expecting a different Type.
Event Log
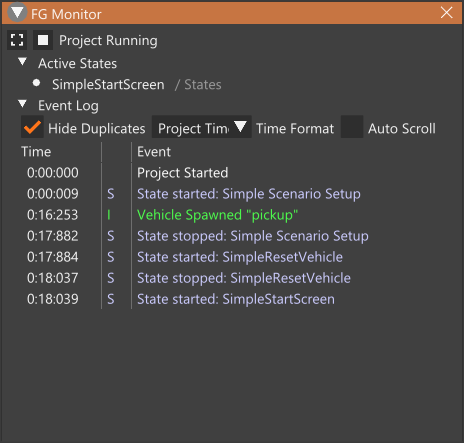
The Event Log is a useful tool for debugging and helping you get a feeling for how your flowgraph is behaving.
It provides you with an overview over events like state changes or even custom log entries.
Overview
Main Part
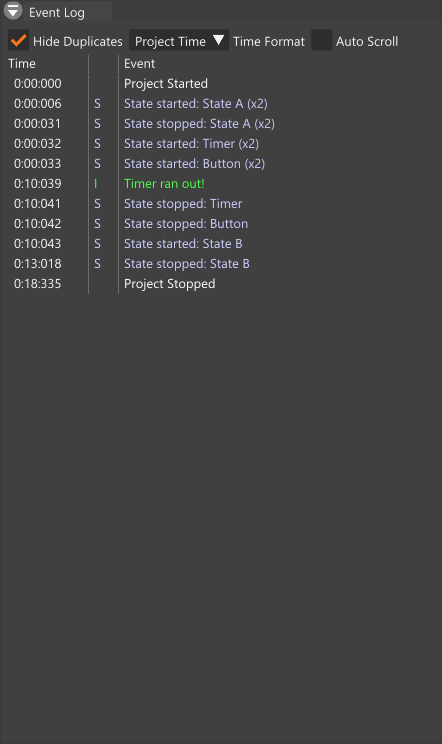
The main part of the Event Log simply displays all log events, that occurred during the current/last runtime of the project.

These events are logged with a time, an event type and the event text. If the option is turned on, it will also display how often this event occurred. These entries will stay until the graph is started the next time.
Some of the entries like state changes are logged automatically by Flowgraph, but you can create your own entries by adding the “Log” node in the appropriate places in your flowgraphs.
Options
The Event Log can be modified through different options at the top of the window.

- Hide Duplicates stacks event duplicates into one log entry, if turned on.
- Time Format allows you to choose between “Project Time”, “Global Time” or “Frame” for the logged time.
- Auto Scroll Toggles automatic scrolling in the Event Log.
Examples
The Examples windows is a simple overview of projects that we have developed to introduce you to different concepts of Flowgraph.
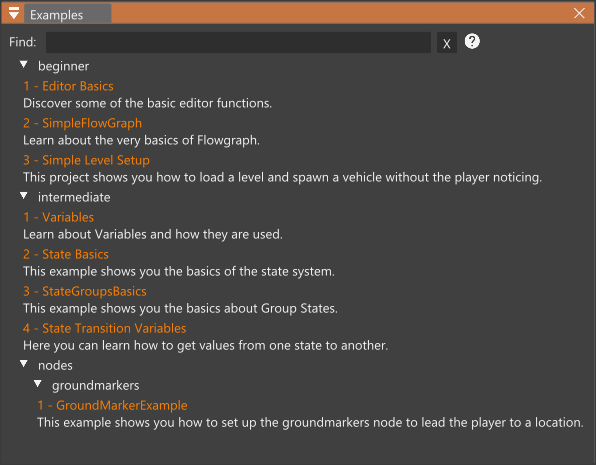
If you are new to Flowgraph we recommend starting with the “Editor Basics” project to get started. After that feel free to explore all the other example projects to get a feeling for what is possible with Flowgraph.
Like all of Flowgraph these examples are in active development and new examples will be added.
History
The History windows gives you an overview of all events and changes made to the project. This means changes made by you in Flowgraph not changes made by Flowgraph in the level.
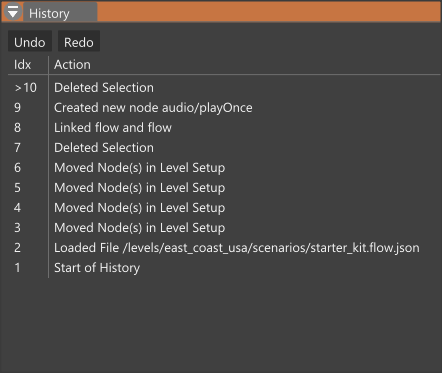
In the window you see an ordered list of all actions taken since loading this project. This history is only a representation of all actions taken in the current runtime. You can click on an action in the list to revert the project to the state, where this action was taken.
Additionally you can use Undo and Redo to go back and forth between actions.
You can also achieve this by using the shortcuts Ctrl+Z and Ctrl+Y.
Node Library
The node gives you an overview of all existing nodes in Flowgraph.
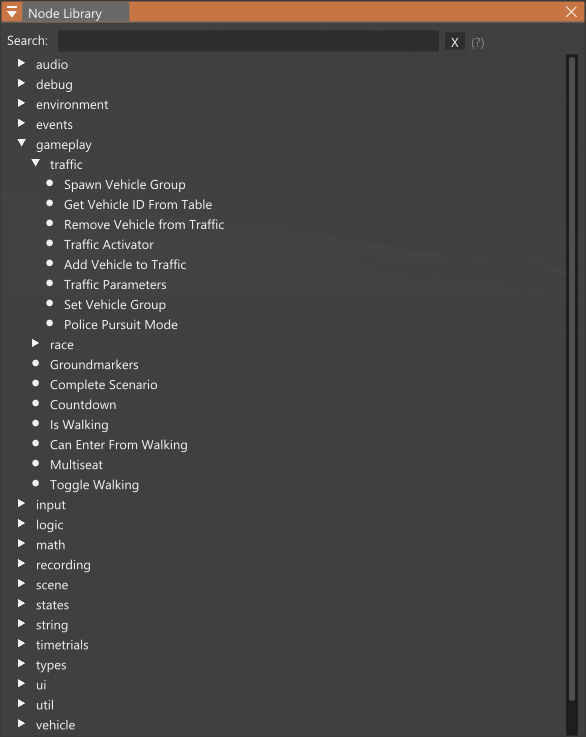
The nodes are displayed in tree and are sorted by their categories. To navigate the tree you can simple expand or collapse the different categories or simply use the the “Search bar” at the top of the window to filter the tree.
You can create a node through the Node Library in two ways:
- Double Left Click the node you want to create and it will appear in the currently viewed graph.
- Hold Left Click and drag the node to a free space in the graph to create it.
Overview
The Overview window displays all the different graphs in your project.
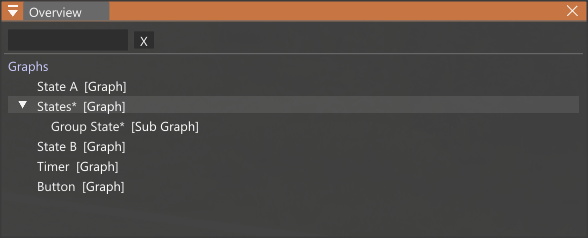
The currently viewed graph is highlighted and another graph can be selected by pressing Left Click on it. If a graph has subgraphs you can expand or collapse them and if there are any unsaved changes on a graph it is marked with a “*”.
Project Settings
The Project Settings let you see and configure all information about your project.
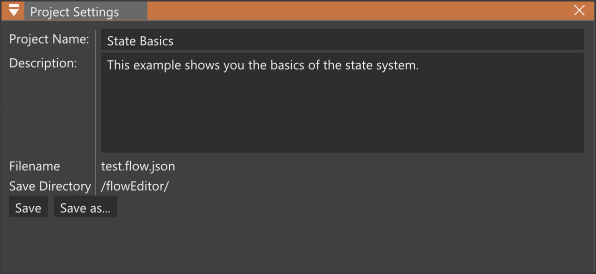
The Project Settings let you edit the project name and description and display the project’s file name and save directory for you.
The Save and Save as buttons let you manage saving your project.
Properties
The Properties window lets you see and configure the properties of your graphs and nodes.
Editing Graphs
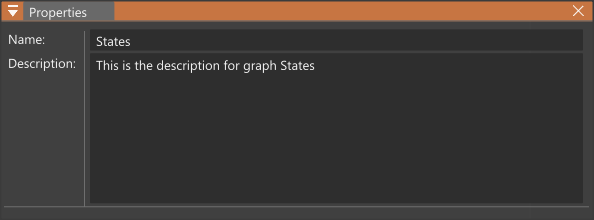
To edit the properties of a graph, open it in the Main window and click on a free space in the graph. This will open the graph in the Properties window and lets you edit the graphs name and description.
Editing Nodes
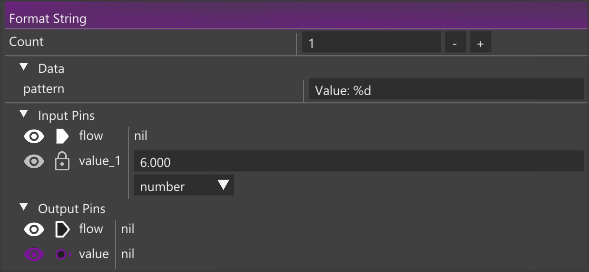
To edit the properties of a node, simply click on it in the Main window. This will open the node in the Properties window.
Each node has its individual properties, but there are three general main sections:
- Data
Data lets you see and edit properties of the node, which are constant during runtime and cannot be changed through a pin. - Input Pins
Input Pins let you see and edit properties of the node, that are relevant input values to be processed by the node. - Output Pins
Output Pins let you see and use relevant data provided by the node after processing the input.
There are different symbols used here, that give you information about the properties:
 is a pin that receives or puts out Flow
 is a pin that receives or puts out a value of a given type
 toggles if the pin is visible in the graph
 marks a hardcoded pin. A hardcoded pin cannot take an external value, but can only be set as a constant value in the Properties window.
References
The Reference window lets you search for the use of a node in other projects.
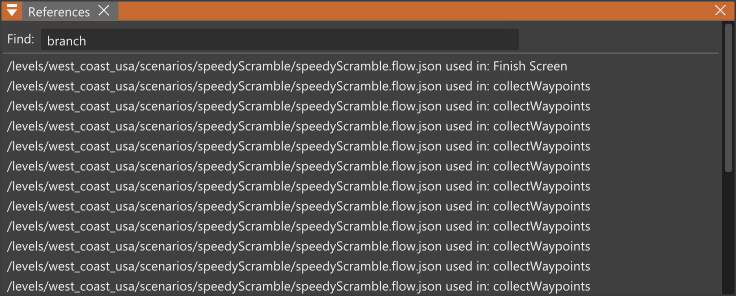
This can be useful, if you want to look at use cases for a certain node in other projects.
Search
The Search window lets you search the project for graphs, nodes or pins.
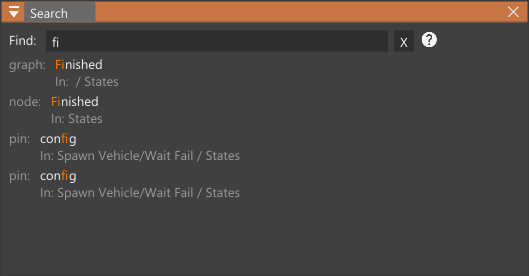
You can search the project for graphs, nodes or pins and then click on the results to view them in the Main window. If you want to only see a certain type of result you can use “graphs:”,“nodes:” or “pins:” before your input.
State View
The State View provides you with an overview over all states in the project and their status.
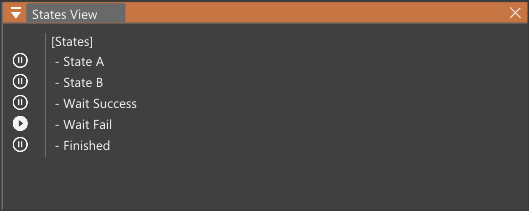
The status of the state is either marked with an (inactive) or  (active) during runtime.
Task Manager
The Task Manager provides an overview of all opened projects.

Similiar to the state view it shows you if a project is (inactive) or (active). You can also play ![]() , stop or close
, stop or close  a project.
Variables
The Variables window provides an overview of all variables in your project.
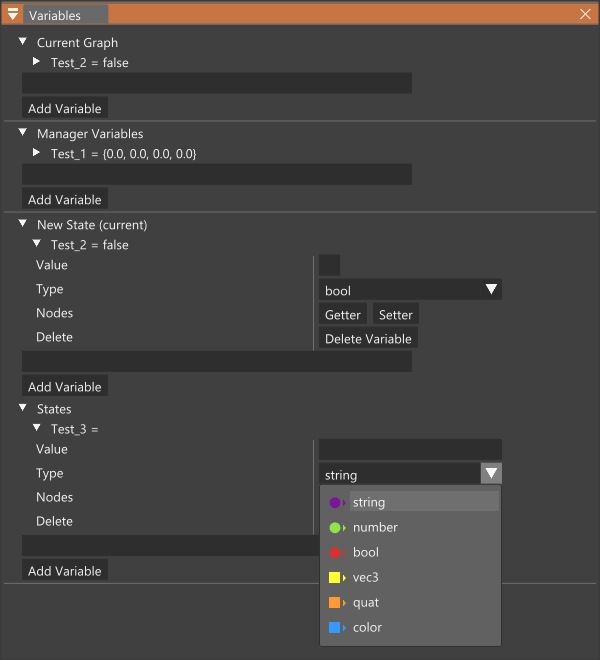
Variables are graph- or project-wide and store a value of a certain type. For more on variables in Flowgraph, you can check out the Variables page . In the Variables window you can see the variables of the current graph, the Manager variables, which are project-wide, and the variables for all other states in the project.
You can create a new variable by typing its name into one of the input fields and then pressing Add Variable. The variable now exists either in the context of the graph or the project.
You can now choose the “type” and the “value” of your variable. The Getter and Setter buttons allow you to create nodes for getting and setting your variable in your currently viewed graph.
You can also use the Delete button to remove the variable if needed.
Was this article helpful?